


.CNhas5IL_ZqBJiz.webp)


Explainable AI for Attribution in Experiential Campaigns

Experiential marketing budgets are growing. Event Marketer data points to a 15% annual increase. Yet 60% of campaigns still lack precise touchpoint tracking. That gap represents millions in unaccountable spend — a problem that brand managers and marketing decision-makers can no longer afford to overlook.
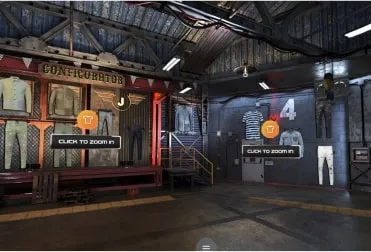
Attribution in immersive environments has always been a measurement challenge. Multi-sensory activations — projection mapping walls, AR overlays, holographic displays, object recognition tables — generate enormous volumes of interaction data. Aggregating that data into meaningful business intelligence requires more than dashboards. It requires a system that can trace each touchpoint to a measurable outcome and explain the connection clearly.
Experiential Campaign Attribution: The Core Measurement Problem
A visitor scans a holographic product render. They interact with an AR overlay. Three days later, they book a demo. Which touchpoint moved them forward?
Traditional analytics cannot answer that question with confidence. They aggregate. They average. They present vague engagement scores that provide no directional clarity. Brand managers end up making budget decisions based on incomplete evidence. Retail heads continue questioning tech investment. Enterprise teams cannot replicate what worked — because they never knew precisely what worked.
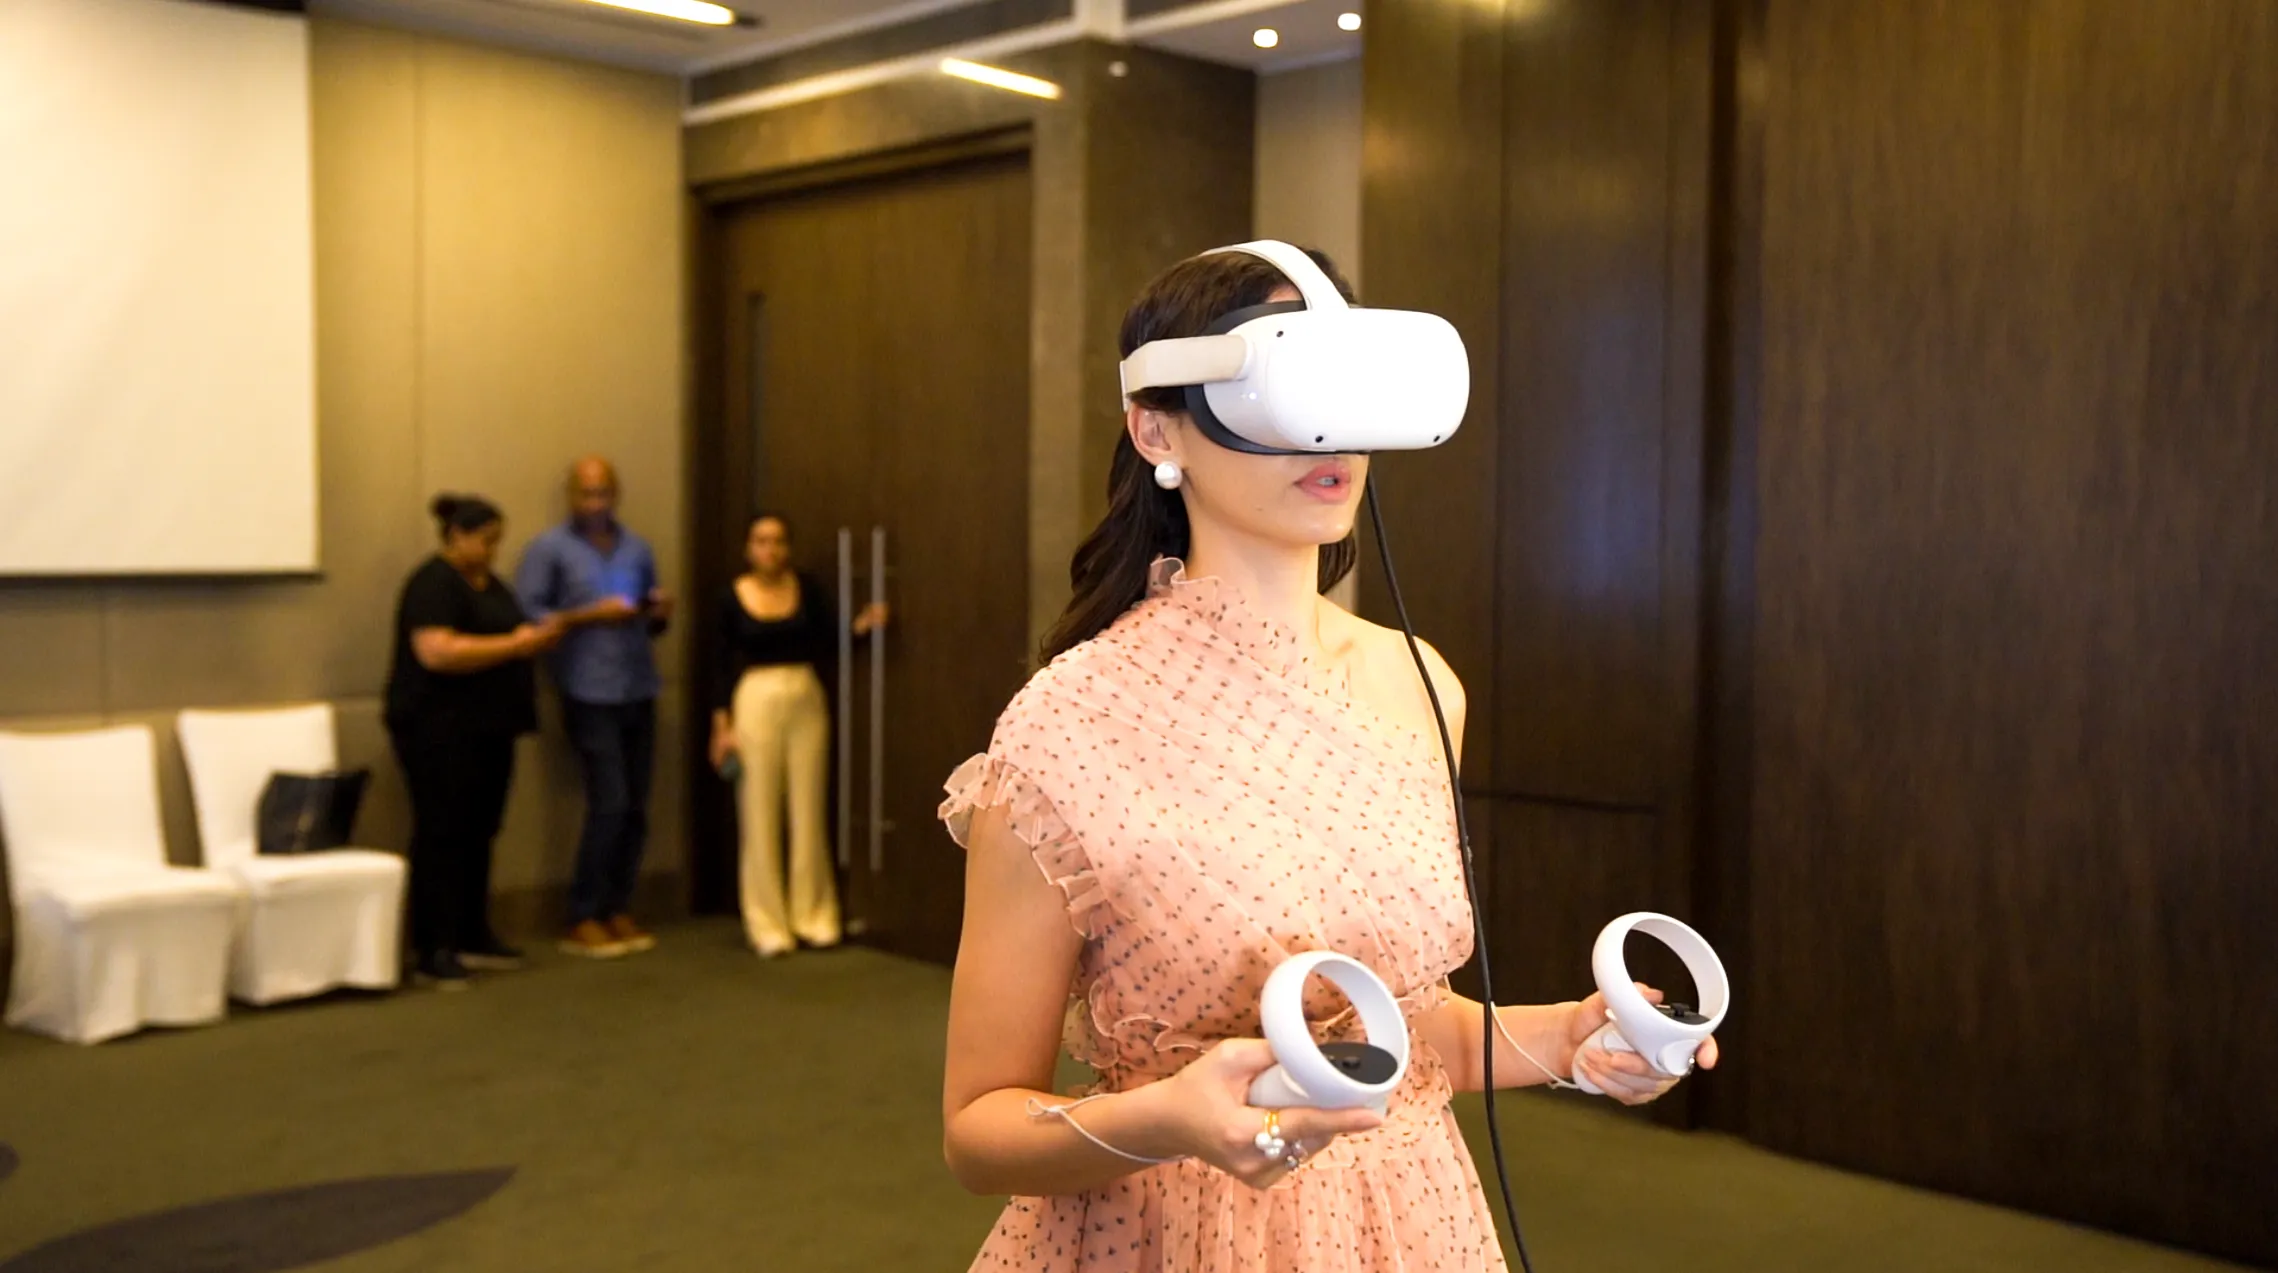
The challenge compounds in multi-sensory environments. Sensors capture dwell time. Cameras detect group dynamics. Microphones log tone and sentiment. AR glasses record gaze patterns. The data exists. The infrastructure to extract signal from that noise has been the missing piece.
Feature Attribution Models in Immersive Environments
The methodology that addresses this gap centers on feature attribution — specifically, techniques like SHAP (SHapley Additive exPlanations) that decompose predictive outcomes into per-element contributions.
In practical terms: every interaction across a live activation gets weighted. A gesture on an interactive wall might account for 25% of lead generation for a given campaign. A projection mapping sequence might drive 35% of social shares. CGI product renders might contribute 20% to inquiry volume. These are not estimates. They are model outputs grounded in real interaction data.
The distinction matters for decision-making. Feature importance scores allow brand teams to prioritize installation elements, reallocate budget mid-campaign, and replicate high-performing sequences in future activations — with evidence.
At Ink in Caps, this methodology integrates directly into the campaign build process. Sensors deploy across installations from the outset. Interaction logs feed into models trained on historical activation data. Outputs sync with CRM systems and export to platforms including Google Analytics and Salesforce.
Real-Time Interaction Logging Across Touchpoints
Every touchpoint leaves a trace. The infrastructure to capture it at scale includes:
Dwell time and movement heatmaps across physical installation zones
Sentiment analysis from voice inputs to AI-powered query assistants
Gaze pattern data from AR glasses for visual hierarchy validation
Group dynamics detection via overhead cameras to assess social influence on engagement
Models run on edge devices to minimize latency. Processing occurs in hours, not days. Dashboard outputs surface peak engagement windows, underperforming elements, and segment-level behavioral differences — all filterable by audience type, campaign phase, or time of day.
This infrastructure scales from single-installation pop-ups to full Experience Centers. Cloud integration maintains data security. Audit trails support compliance requirements at the enterprise level.
Mumbai Luxury Brand Activation: Attribution in Practice
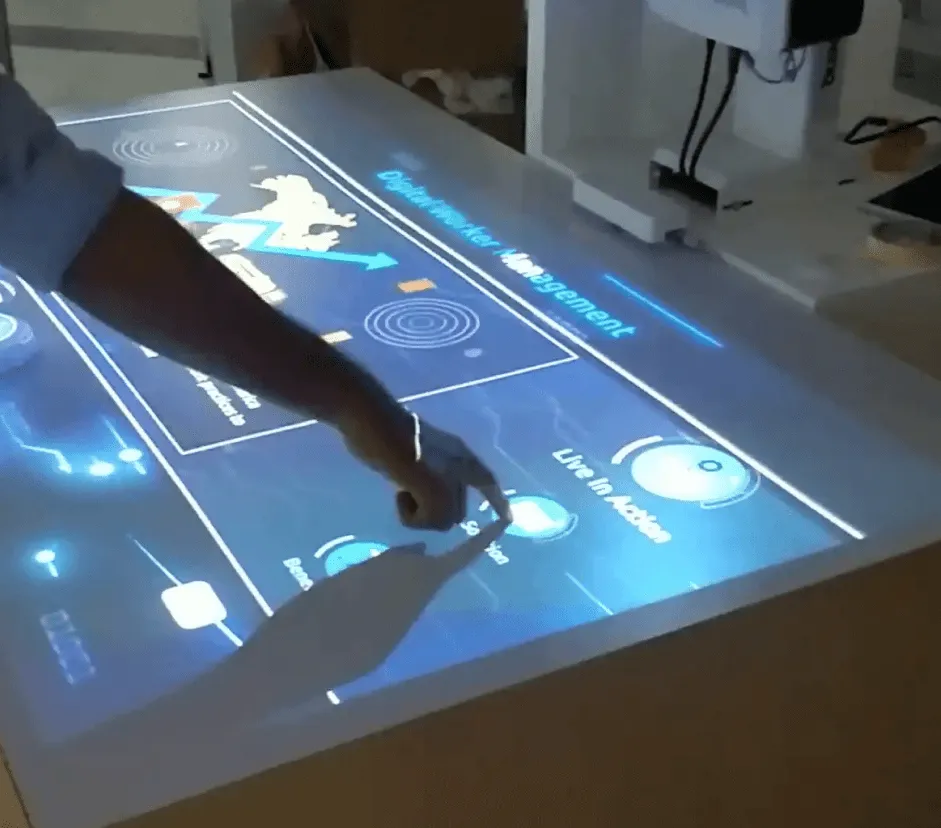
The clearest validation of this approach came through a luxury retail activation in Mumbai. The setup: a 360-degree projection mapping wall, AI-powered query assistants, and object recognition tables. Over three days, more than 5,000 visitors engaged with the installation.
Initial analytics showed a 15% conversion rate — a credible number, but with no explanation. Leads dropped sharply after the event closed. The brand team had no data indicating which elements to retain, scale, or cut.
Ink in Caps applied the attribution framework to 2TB of sensor data collected across the activation. The model outputs were direct:
42% of bookings traced to object recognition table interactions
28% attributed to the projection mapping wall
18% linked to AI assistant conversations
Static display elements scored below 5% across all conversion metrics
The dashboard revealed something the aggregate data had obscured: peak engagement occurred at hour three of each session, driven by group demonstration sequences rather than individual exploration. Sentiment analysis on AI assistant transcripts identified specific query themes that consistently preceded purchase conversations.
That level of granularity changed the brand's decision-making process. The activation extended. Specific elements from the immersive environment were replicated in permanent retail locations. Sales lifted 27% quarter-over-year. The investment case became replicable.
Attribution Data That Connects to Business Outcomes
The broader industry context reinforces why this capability matters now. Gartner research indicates that 70% of enterprises will require interpretability from analytical systems by 2026. Brands investing in immersive campaigns need attribution models that can stand up to internal scrutiny — that can answer a CFO's question about ROI with specificity rather than proxy metrics.
Partners who have implemented this framework report 3x faster ROI decisions compared to campaigns running traditional analytics. The reduction in time-to-insight directly affects the ability to optimize mid-activation, scale successful elements, and brief agencies with accurate performance data for subsequent campaigns.
Explainability closes the loop between creative investment and commercial outcome. It converts sensor data into institutional knowledge. And it provides the evidence base that allows experiential campaigns to compete on equal terms with performance channels in budget allocation conversations.
Precision Measurement as a Competitive Advantage
Immersive campaign environments will continue to grow in complexity. More sensors. More interaction modalities. More data. The brands that convert that complexity into competitive advantage will be the ones with attribution infrastructure capable of separating signal from volume.
If your next activation — a product launch, an Experience Center build, a retail installation — is generating interaction data without a clear attribution layer, that data depreciates the moment the event closes. The interaction logs exist. The conversion patterns are traceable. The infrastructure to connect them is available.
Ink in Caps audits existing activation setups and designs attribution frameworks for upcoming campaigns. If measurement precision is a standing item on your marketing planning agenda, it warrants a direct conversation.
About the Author

SEO Executive
MORE FROM OUR CREATIVE MIND
 Get Everyone's Attention With These Amazing Experiences
  Is 3D Projection Mapping The Future Or The Present?
 About the Author
SEO Executive
MORE FROM OUR CREATIVE MIND
Get Everyone's Attention With These Amazing Experiences Is 3D Projection Mapping The Future Or The Present? 


Contact Us Now: