
.CNhas5IL_ZqBJiz.webp)


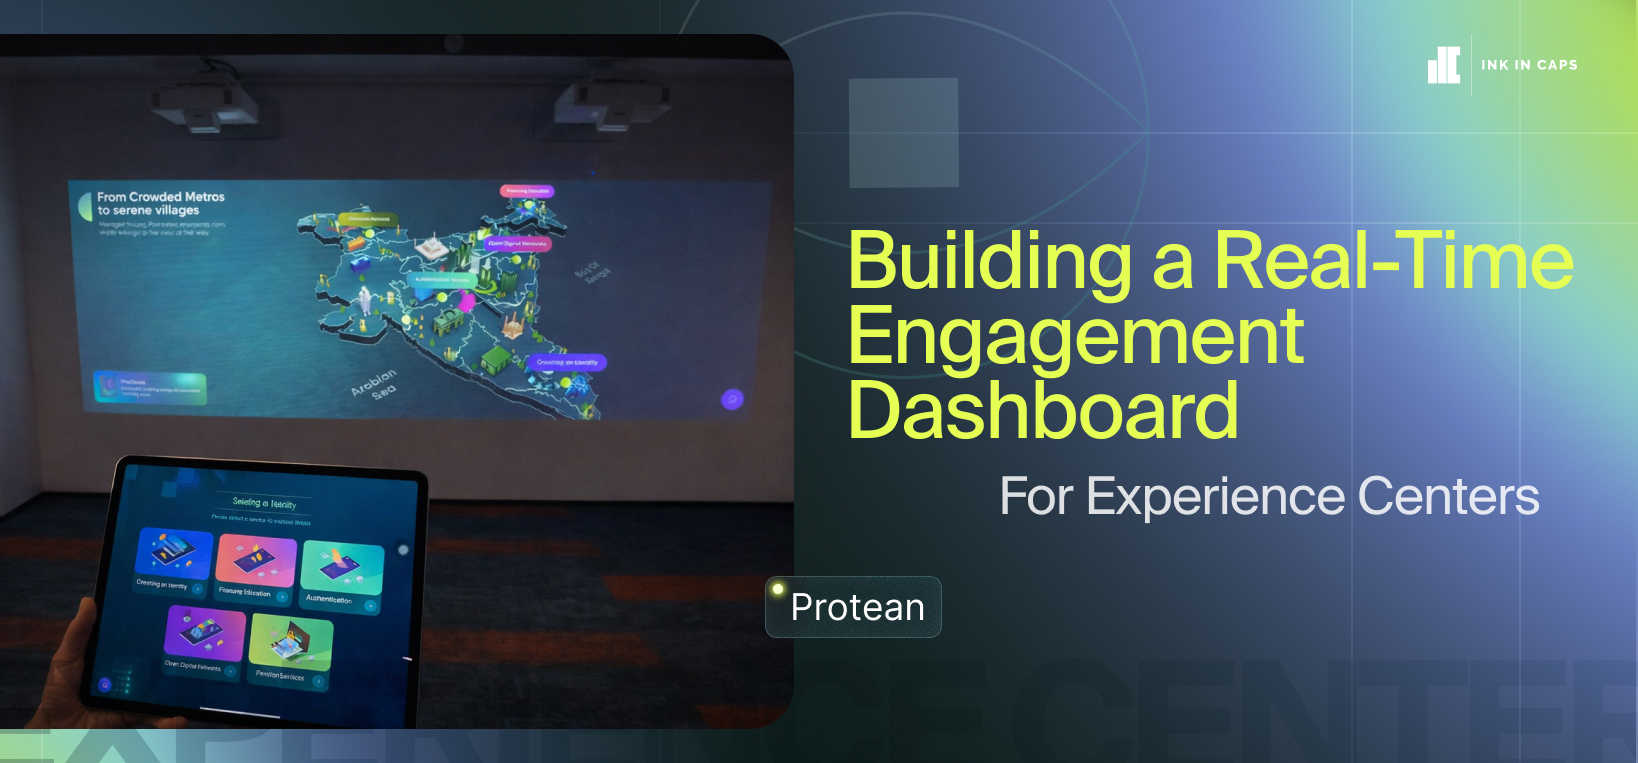
Building a Real-Time Engagement Dashboard for Experience Centers
Experience centers generate enormous volumes of visitor data. Every swipe on an interactive wall, every second spent at a holographic display, every object picked up from a recognition table — all of it carries signal. The challenge most brands face: that signal arrives too late to act on.
Post-event reports have a shelf life. By the time data surfaces, the opportunity to intervene has passed.
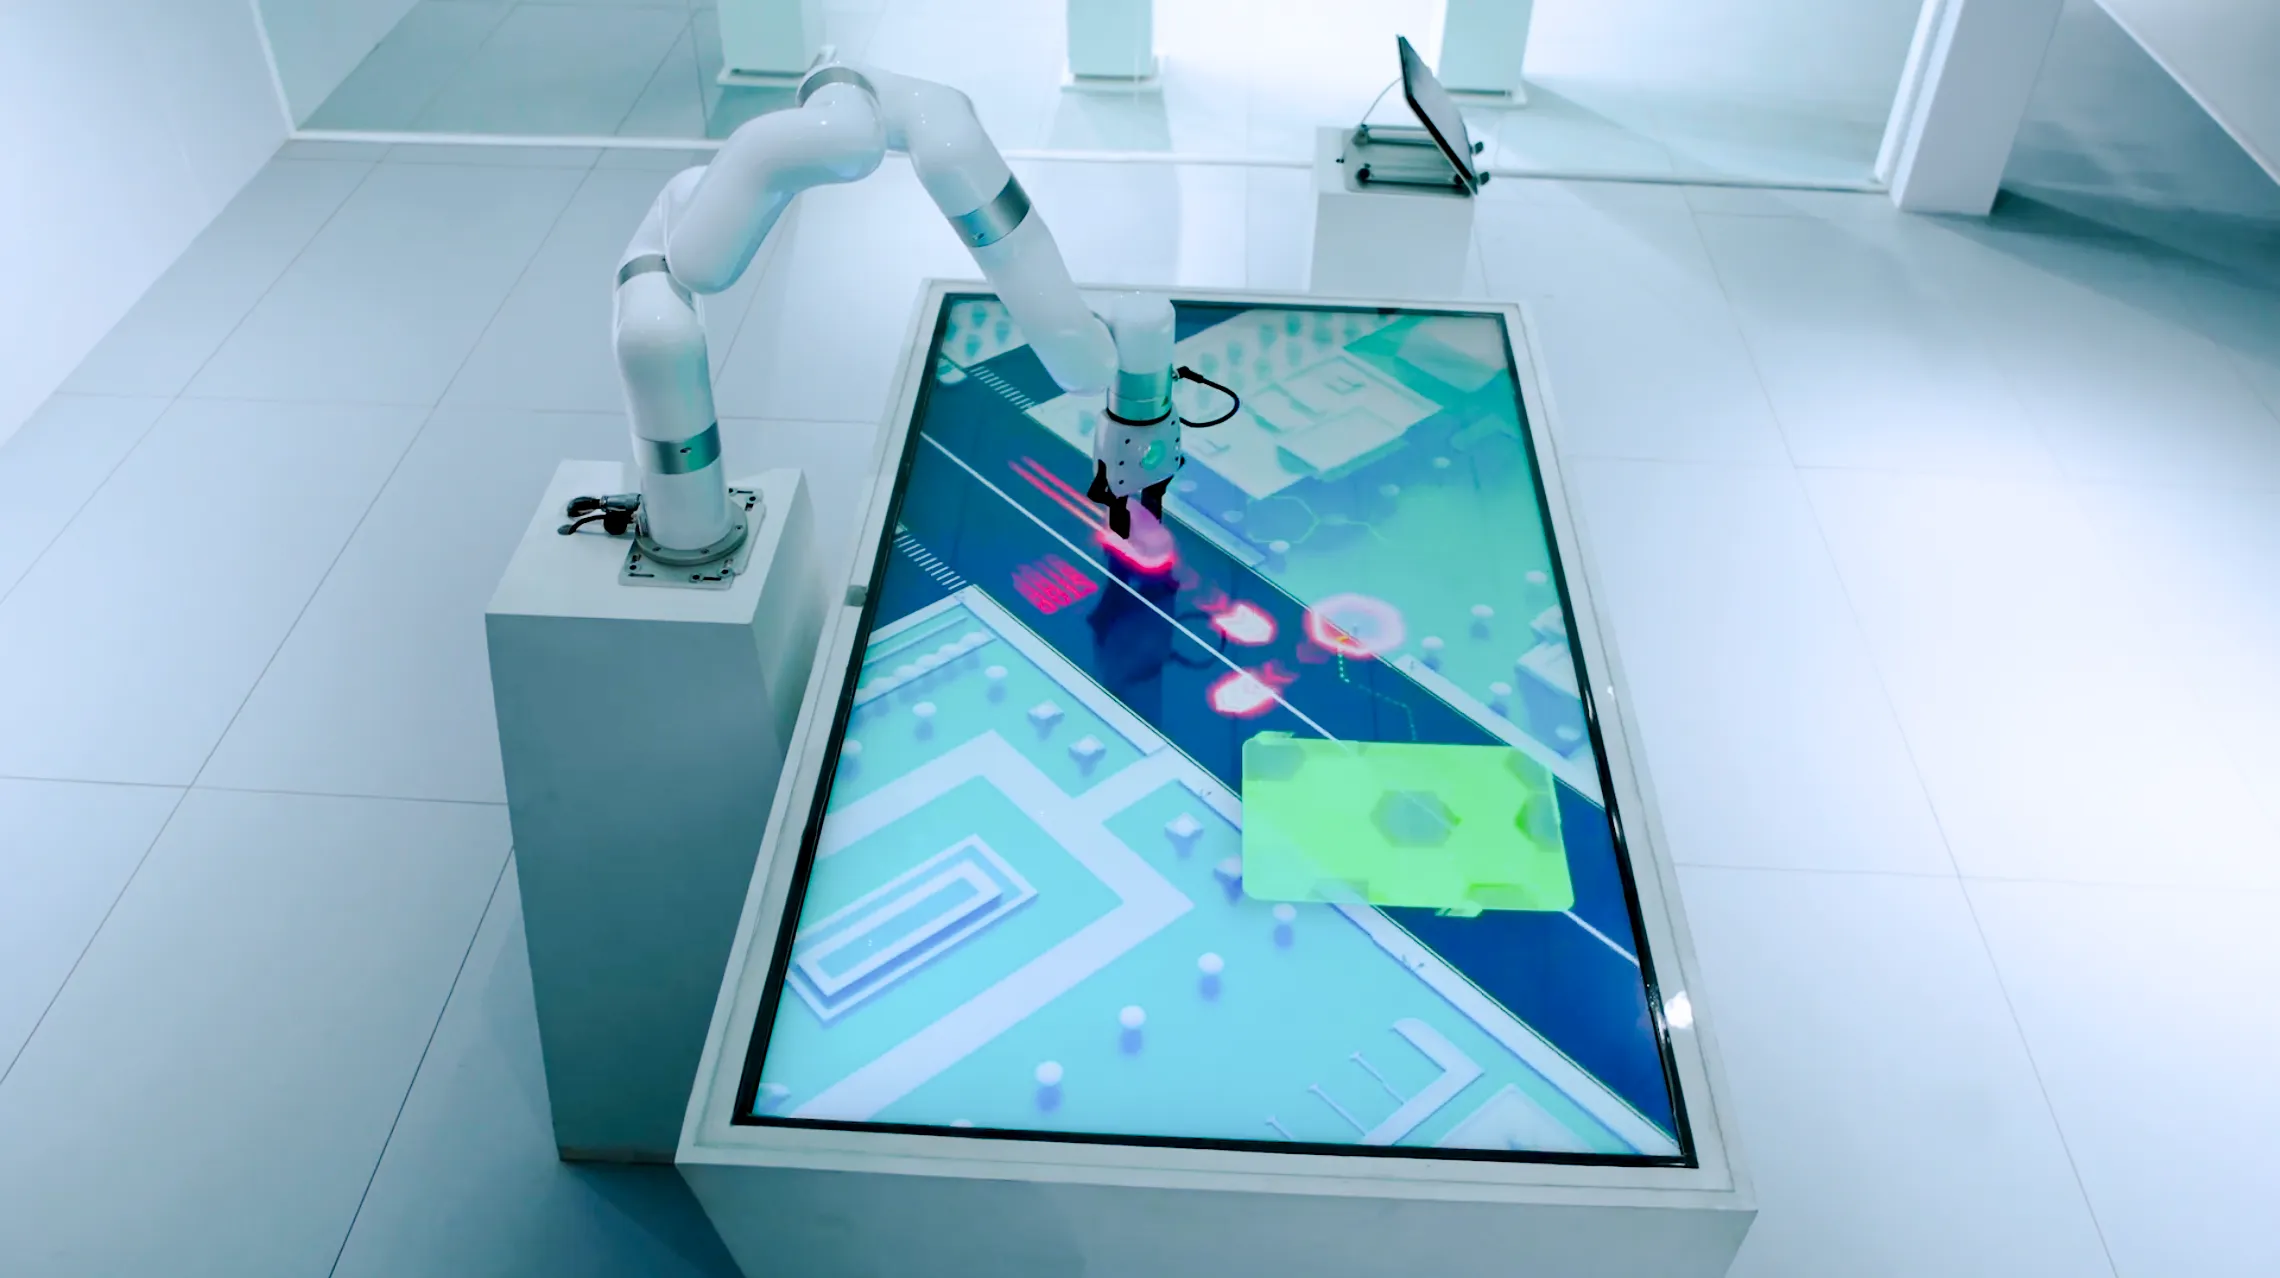
This piece details a live dashboard build Ink In Caps completed for a luxury retail client running a 300-square-meter flagship experience center — a space combining AR projections, touch-sensitive floors, and AI-guided tours serving approximately 500 visitors daily.
Experience Center Analytics: The Core Gap
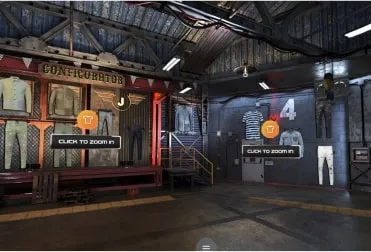
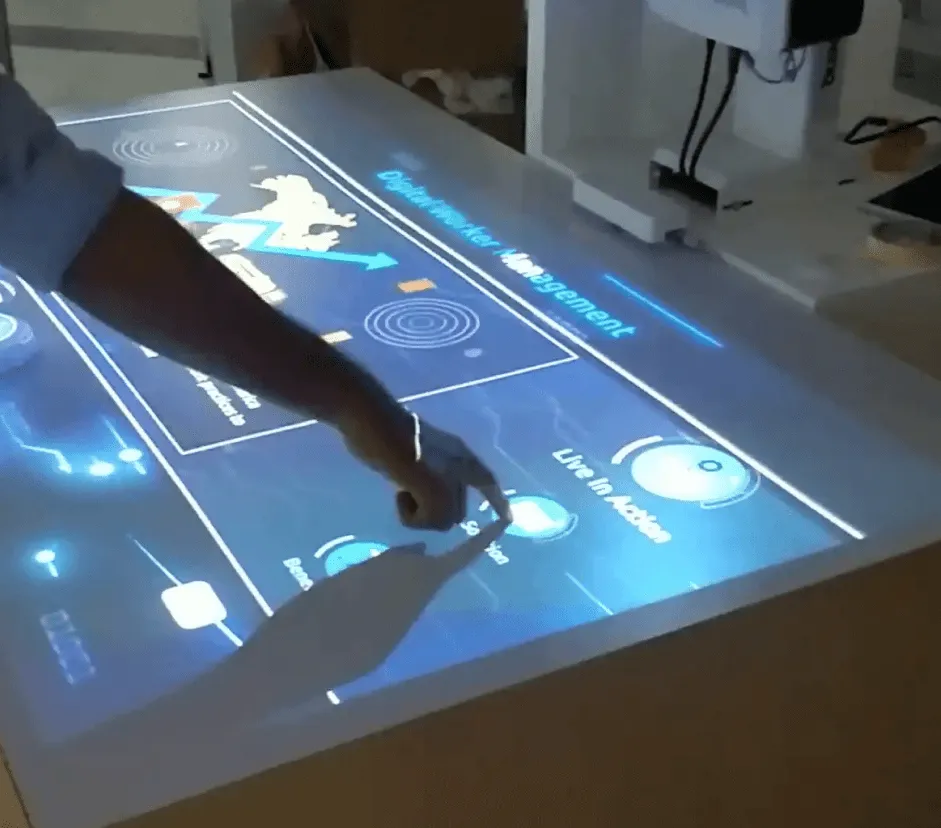
Visitor journeys across multi-zone environments rarely fit into a single data stream. Interactive walls attract clusters. Holographic product demos hold extended attention. Object recognition tables drive trial behavior. Each zone produces its own data — and most analytics setups treat them separately.
That fragmentation creates a visibility problem.
Dwell time metrics don't capture intent. Footfall counts miss sentiment shifts. Aggregate averages obscure zone-level performance. The client's team was making programming decisions based on surveys collected after sessions ended. A 15% dip in conversions had been traced to poor zone traffic flow — but the diagnosis came weeks after the fact.
Real-time visibility into multi-zone engagement wasn't a convenience. It was a commercial requirement.
Dashboard Architecture and Technical Foundation
The build rested on a modular stack designed for reliability under load.
A Node.js backend handled continuous data streams. Redis caching maintained sub-second latency across concurrent connections. The frontend ran on React, delivering responsive views across web and mobile. AWS cloud infrastructure absorbed traffic spikes without degradation.
Data sources fed into a unified PostgreSQL data lake:
Computer vision cameras generating live heatmap overlays
RFID tags logging object pick-up events at recognition tables
Microphones capturing voice query volume at AI-guided tour stations
IoT sensors tracking zone occupancy in real time
APIs pushed updates every two seconds. Role-based access controlled visibility by team level. The entire system was stress-tested against 1,000 concurrent users before launch. Uptime reached 99.9%. CRM integration routed lead capture data directly downstream.
Deployment completed in six weeks.
Dashboard Features Built for Operational Decision-Making
Live Heatmaps Color-coded floor overlays show active dwell zones in real time. Red hotspots indicate high-engagement clusters. Brand managers use this to reroute visitor flow within minutes — not after the day ends.
Interaction Metrics Counts swipes, gestures, and product trials. Demographic breakdowns from opt-in facial recognition add context to behavioral data. Teams see not just what visitors do, but how different segments engage differently.
Sentiment Tracking Voice tone and facial expression analysis produce engagement scores on a 1–10 scale. Frustration spikes trigger immediate alerts. Staff can intervene before friction compounds into disengagement.
Conversion Funnels Entry-to-purchase-intent tracking runs continuously. Drop-off alerts prompt live staff intervention. The funnel operates as a live instrument, not a retrospective chart.
Custom Alert Logic Threshold-based notifications push to Slack or email. A low interaction signal in a demo zone, for example, automatically prompts a content swap. Teams respond to conditions as they form.
Historical Trend Overlay Daily and weekly views layer over live data for context. Reports export to PDF for board-level presentations.
Operational Impact: Numbers from the Deployment
Within the first month, the results were measurable across every tracked KPI.
Engagement rate increased 28%. Peak-hour conversions doubled. Staff alert response time dropped to one-third of the previous baseline.
One specific instance illustrated the system's operational value clearly. Holographic demo engagement fell sharply around midday. The dashboard flagged the drop. Content was swapped within the hour. Trial activity at that station climbed 45% before the session ended.
That kind of intervention doesn't happen with lagging reports. It requires live visibility.
The data also informed budget decisions at the C-suite level. Expansion to two additional sites followed directly from dashboard-backed performance evidence.
Scalability Across Activation Formats
The architecture was built to transfer. The same pipeline now feeds dashboards for projection mapping events and product launch activations outside the flagship environment. Sensor inputs vary. The underlying logic holds.
For brands running multiple activation formats — permanent experience centers, seasonal pop-ups, trade event installations — a modular dashboard architecture avoids rebuilding from scratch each time.
The infrastructure scales. The data model adapts. The operational intelligence carries forward.
Relevance for Experience Center Decision-Makers
Immersive environments justify significant capital investment. That investment requires measurable accountability — not qualitative feedback collected weeks later.
Real-time engagement data changes how teams operate. Programming decisions happen during activations. Staffing adjustments respond to live signals. Conversion gaps surface while there is still time to close them.
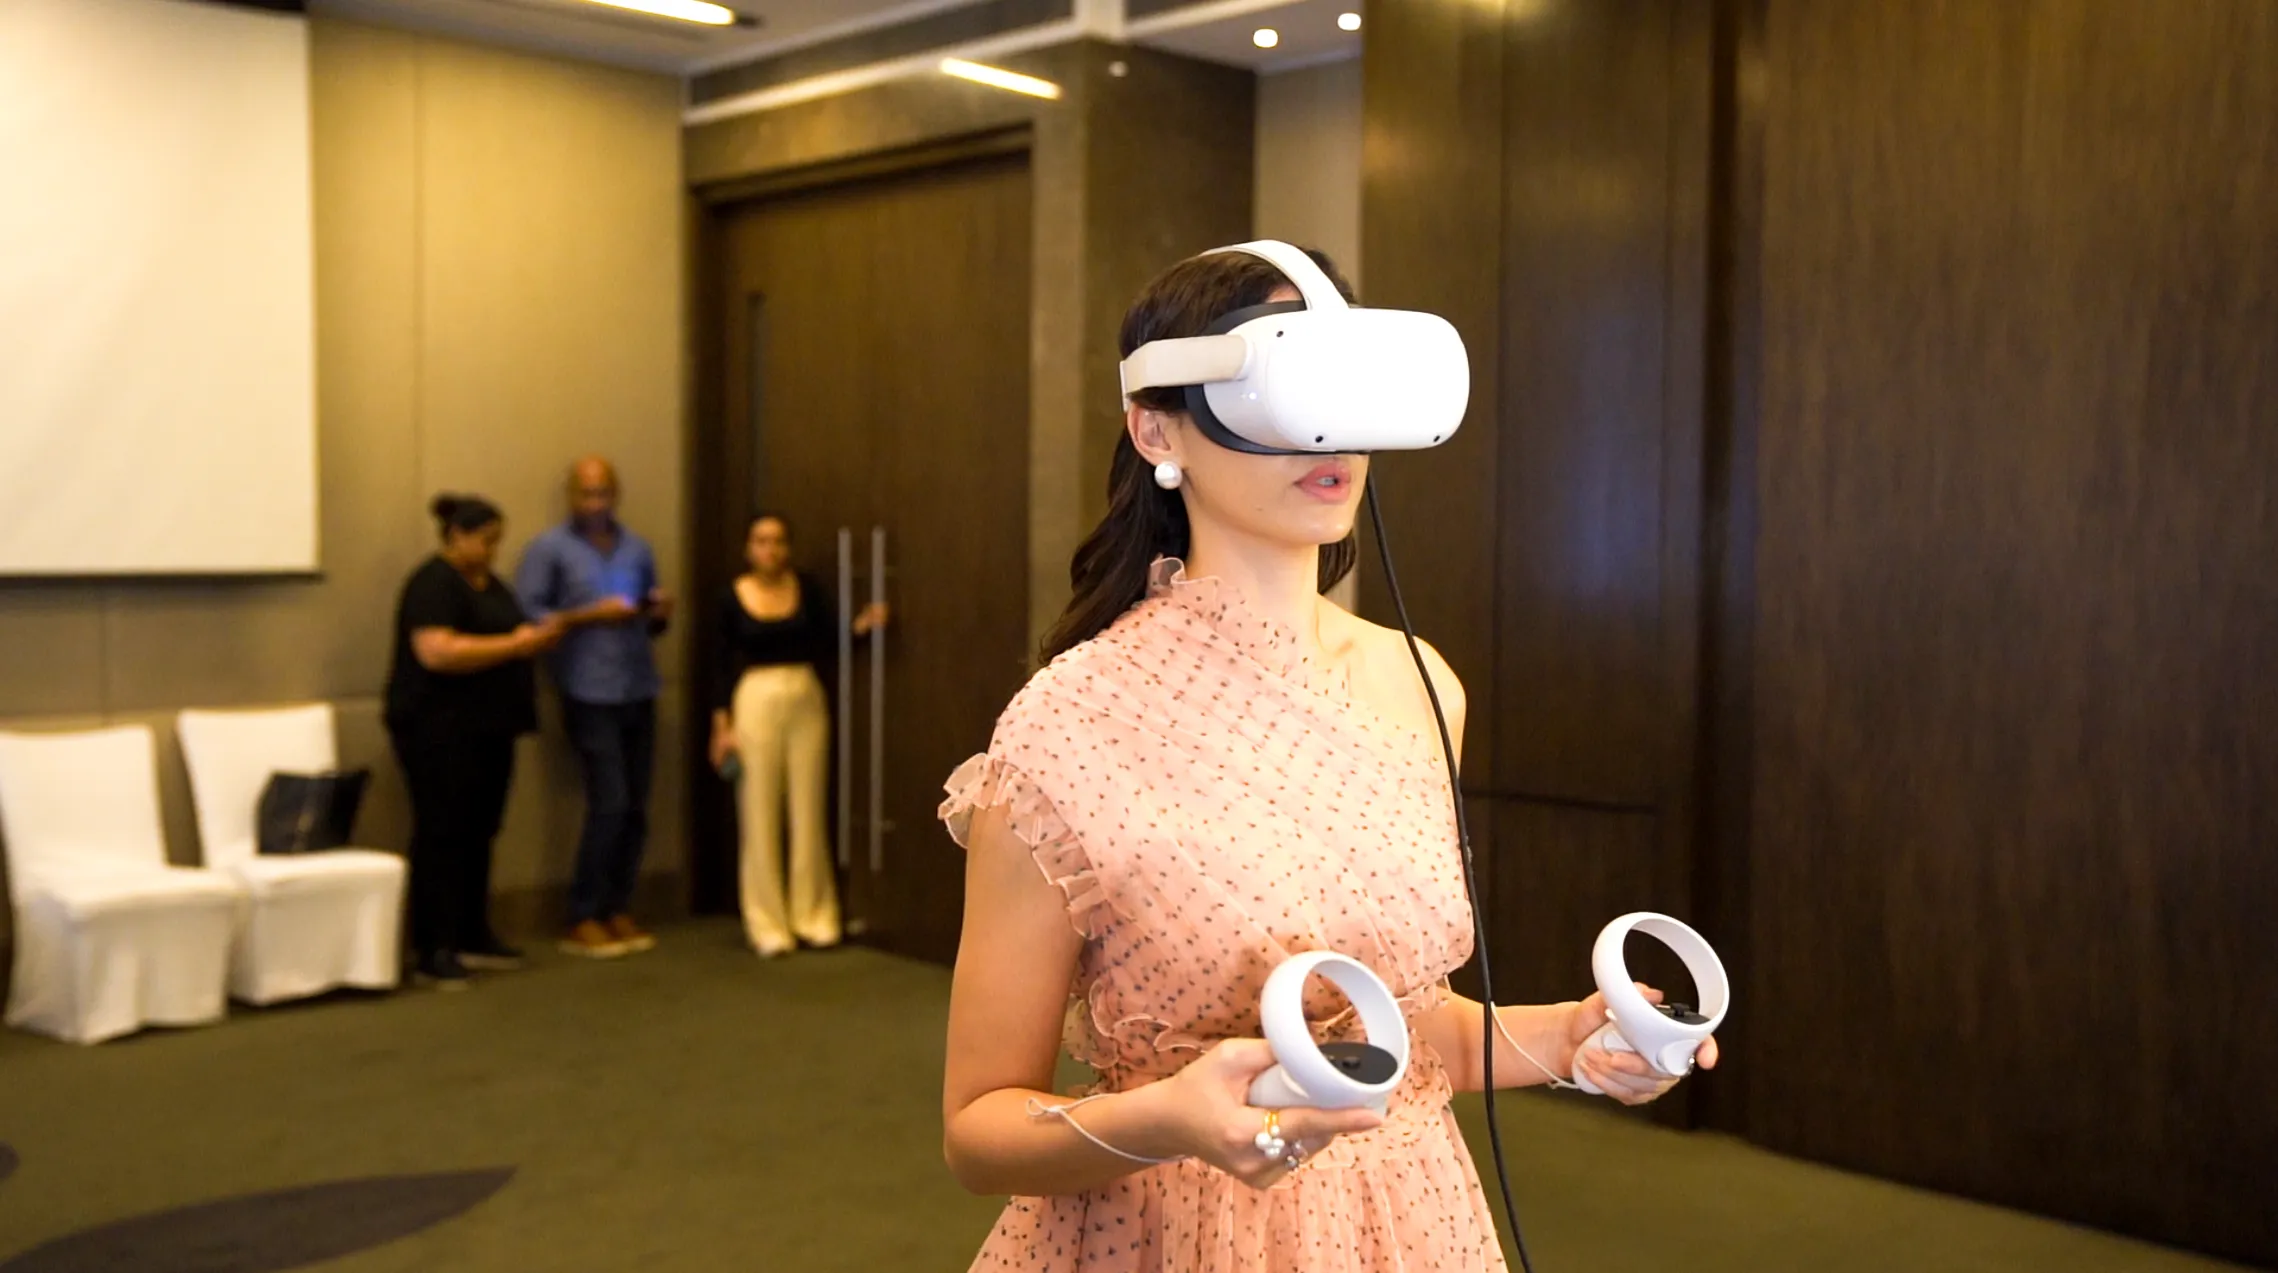
Ink In Caps builds these systems for brands that need precision across AR and VR installations, interactive experience centers, and large-scale product launches. The integration layer connects with existing CRM infrastructure. The outputs are designed for teams that make decisions fast and need data they can trust.
If your current analytics setup runs behind your activation schedule, that gap has a measurable cost. Reach out to Ink In Caps to audit your existing setup and explore what a purpose-built engagement dashboard would look like for your next experience center.
About the Author

SEO Executive
MORE FROM OUR CREATIVE MIND
 Get Everyone's Attention With These Amazing Experiences
 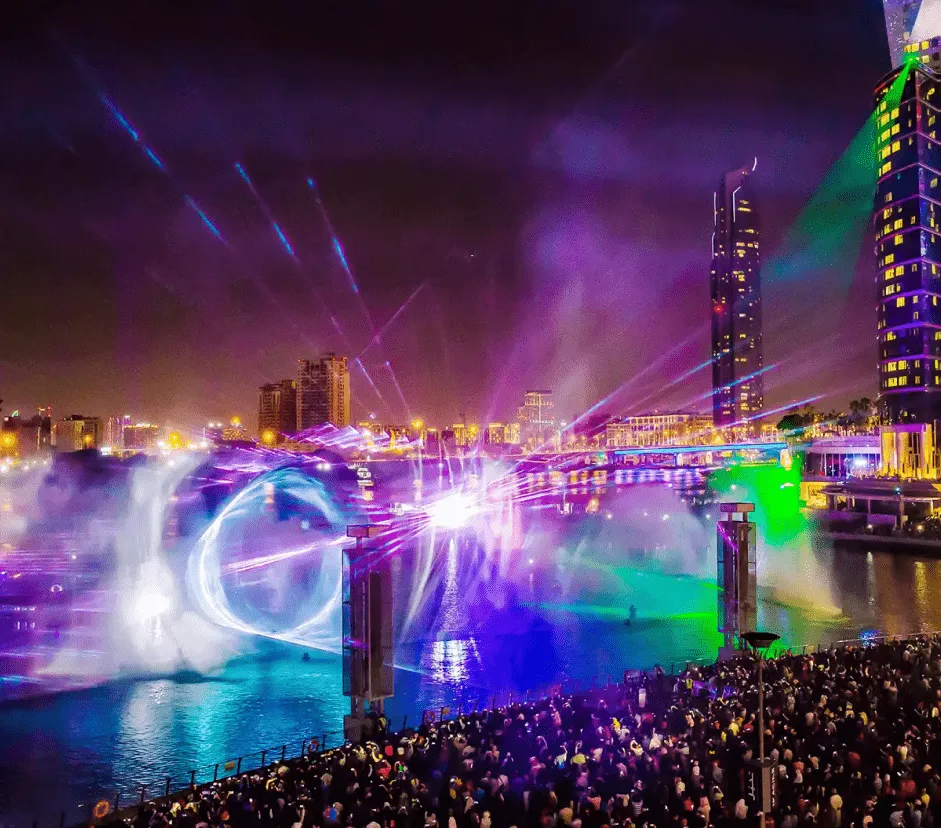 Is 3D Projection Mapping The Future Or The Present?
 About the Author
SEO Executive
MORE FROM OUR CREATIVE MIND
Get Everyone's Attention With These Amazing Experiences Is 3D Projection Mapping The Future Or The Present?  Protean —
 EXPERIENCE THE FUTURE : A HYPER-REAL, INTERACTIVE 180-SECOND IMMERSION
 Contact Us Now: