

.CNhas5IL_ZqBJiz.webp)


How AI Analytics Increased Dwell Time and Lead Quality at a Launch

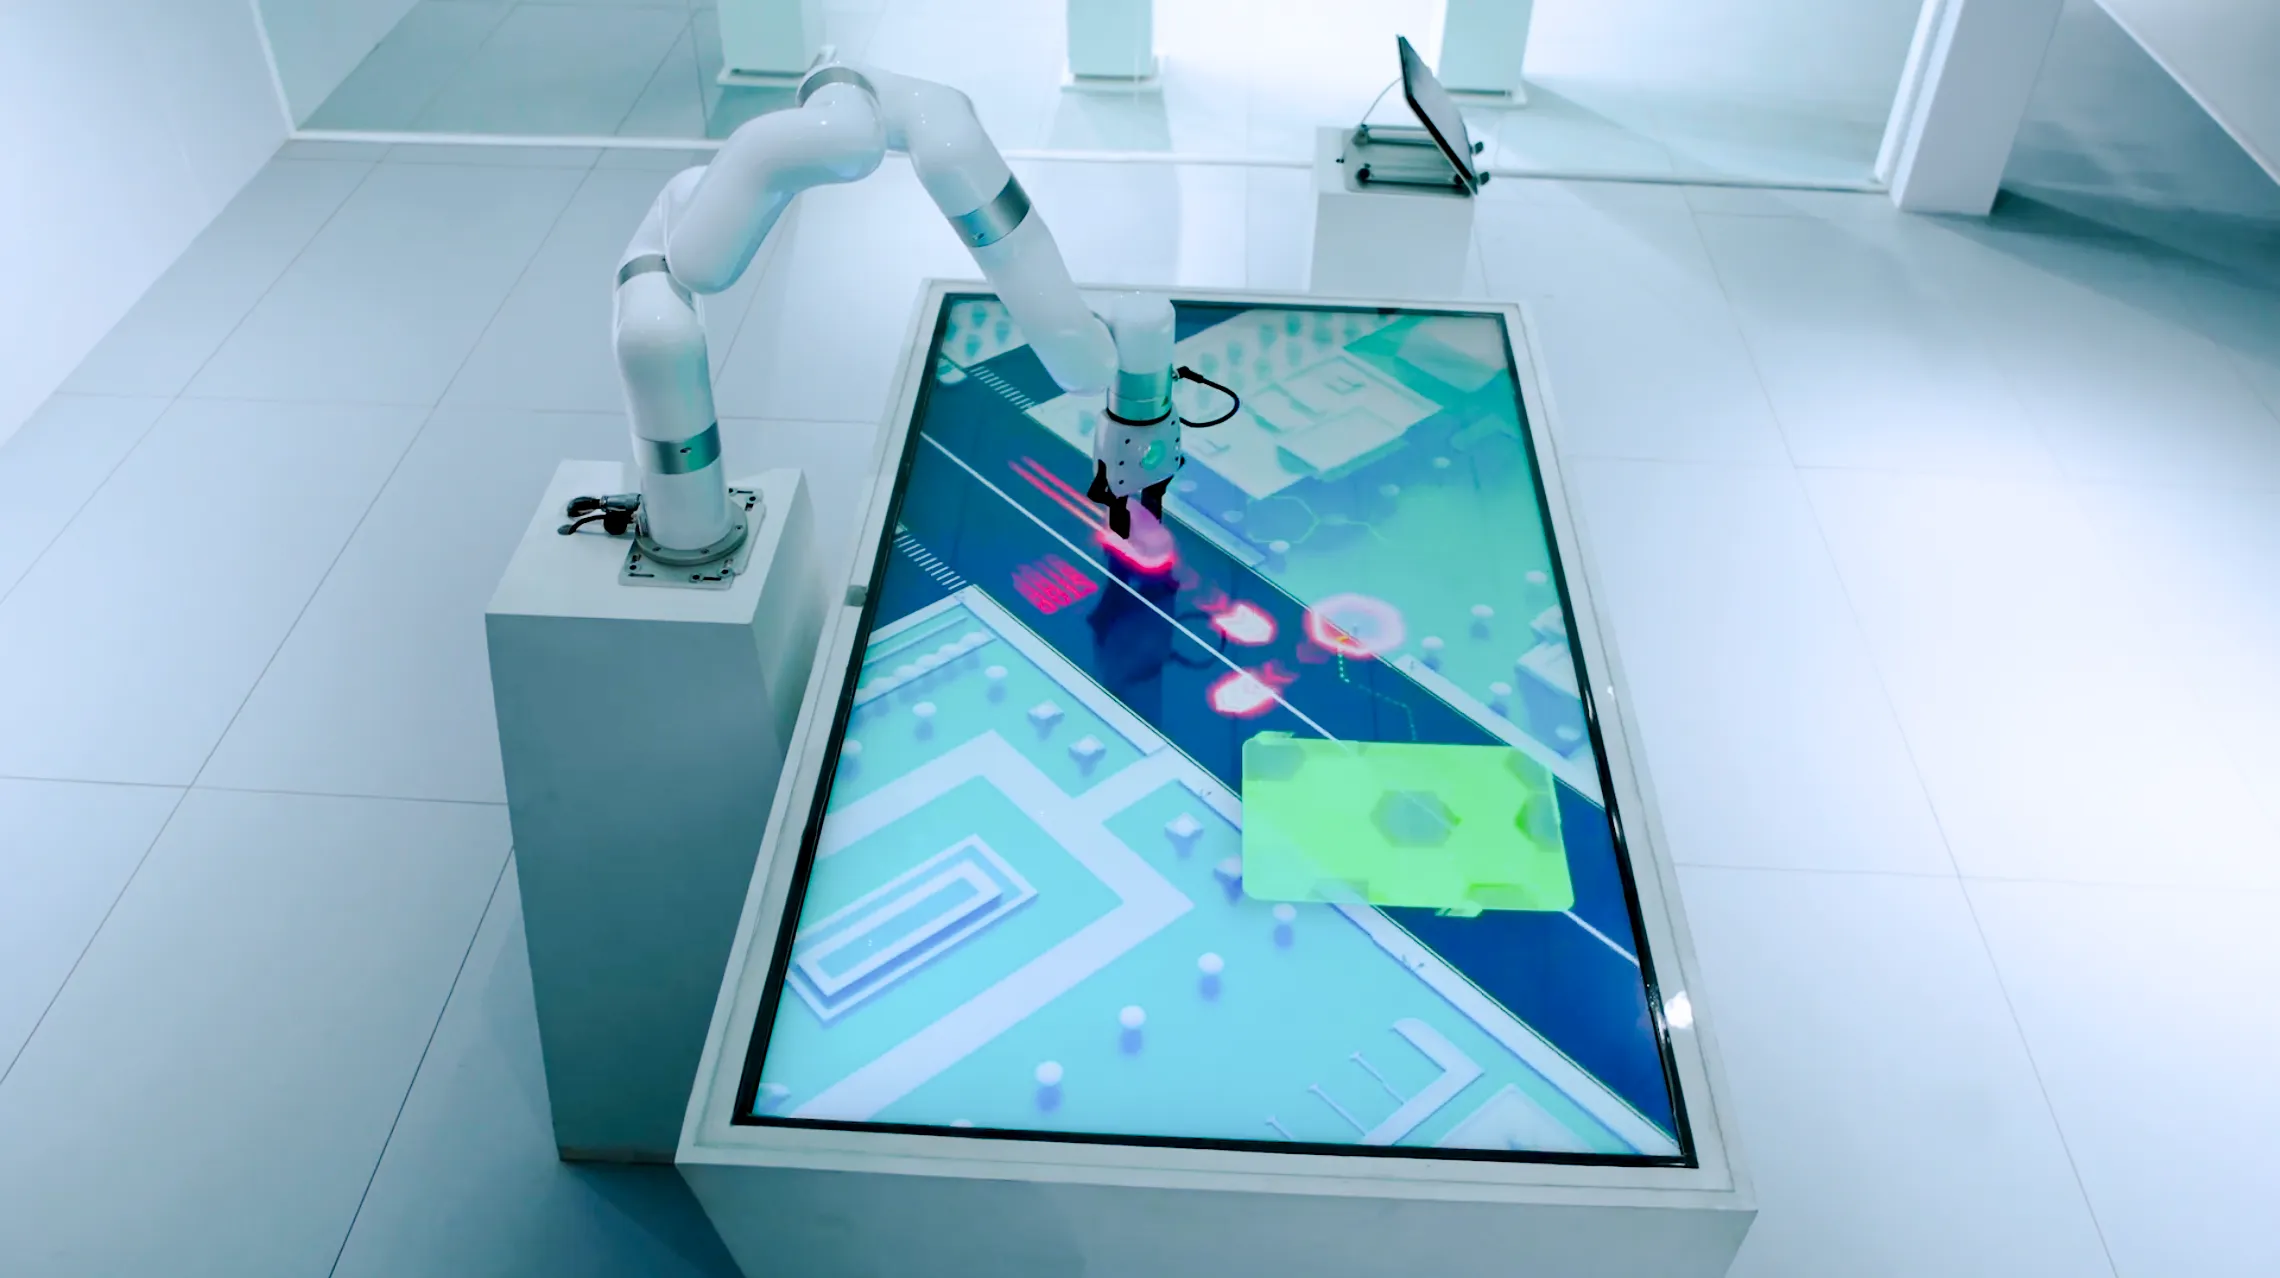
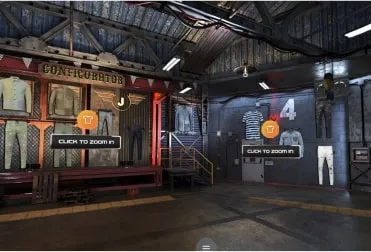
Ink In Caps delivered immersive content for a high-profile product launch. The event targeted enterprise decision-makers in retail and tech sectors. Attendees explored interactive installations blending AR overlays with physical displays. Standard metrics tracked footfall and basic interactions. Organizers needed deeper insights into engagement patterns.
Product Launch Challenges
Event footfall hit 1,200 visitors over two days. Basic scans captured 450 leads. Dwell time averaged 2.3 minutes per station. Lead quality suffered from low conversion rates downstream. Marketing teams lacked visibility into visitor behavior. Real-time data gaps hindered on-site adjustments. Follow-up efforts yielded only 12% response rates.
Implementing AI Analytics Platform
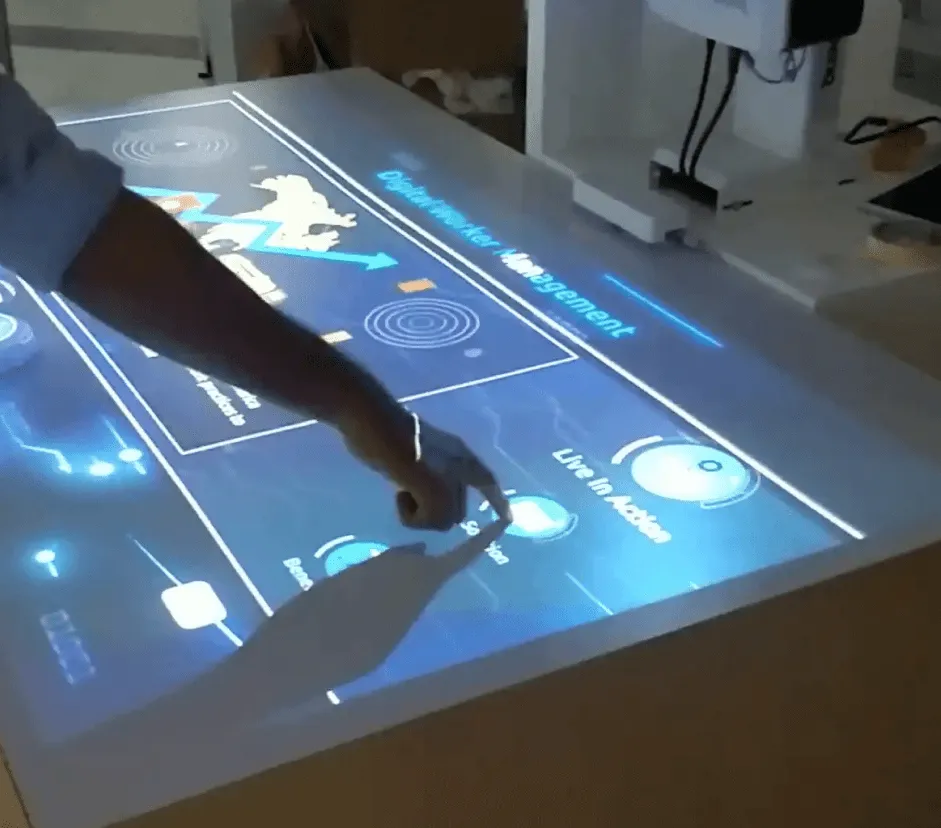
Ink In Caps integrated a custom analytics layer. Heatmaps tracked gaze direction and movement paths. Sentiment analysis processed facial expressions via edge devices. Session data logged interaction sequences. The platform processed inputs from 28 cameras and 12 interactive tables. Data streamed to a central dashboard in under 2 seconds. Teams accessed live visualizations during the event.
Key Analytics Features Deployed
Heatmaps revealed peak engagement zones. Visitors clustered around holographic product demos, boosting dwell time by 47% in those areas. Staff repositioned elements based on real-time flows.
Sentiment scoring gauged reactions. Positive signals correlated with 3x higher lead capture. Neutral or negative zones prompted immediate content tweaks, like swapping AR filters.
Behavioral sequencing mapped journeys. Common paths showed 68% of high-dwell visitors hit the object recognition table last. This informed lead prioritization.
Dwell time segmentation pinpointed drop-offs. Sessions over 4 minutes converted at 28% versus 5% for shorter ones. Alerts flagged low-engagement clusters for intervention.
Privacy controls anonymized data per GDPR standards. Integration with CRM systems auto-tagged leads by score.
Measurable Results Achieved
Average dwell time rose to 5.8 minutes—a 152% increase. Qualified leads jumped from 450 to 712, with 41% scoring high on intent metrics. Post-event conversion rates hit 32%, tripling prior benchmarks. Organizers reported 22% higher ROI from refined follow-ups. One client noted faster pipeline velocity due to prioritized outreach.
Visuals from the dashboard confirmed patterns. Heatmaps glowed red in high-traffic demo zones. Timeline graphs showed dwell spikes after sentiment-driven adjustments. These outputs equipped teams for precise scaling.
Analytics Impact on Lead Quality
High-dwell visitors shared distinct traits. They engaged multiple stations sequentially. Sentiment scores above 0.7 predicted 85% conversion likelihood. Low-quality leads showed fragmented paths and quick exits. Segmenting by these metrics refined nurturing strategies. Email open rates for top-tier leads reached 67%. Sales cycles shortened by 18 days on average.
Ink In Caps refined the platform post-launch. Iterative tweaks enhanced accuracy for future events. Current versions handle 5,000+ concurrent sessions with 99.2% uptime.
Scaling Immersive Analytics for Launches
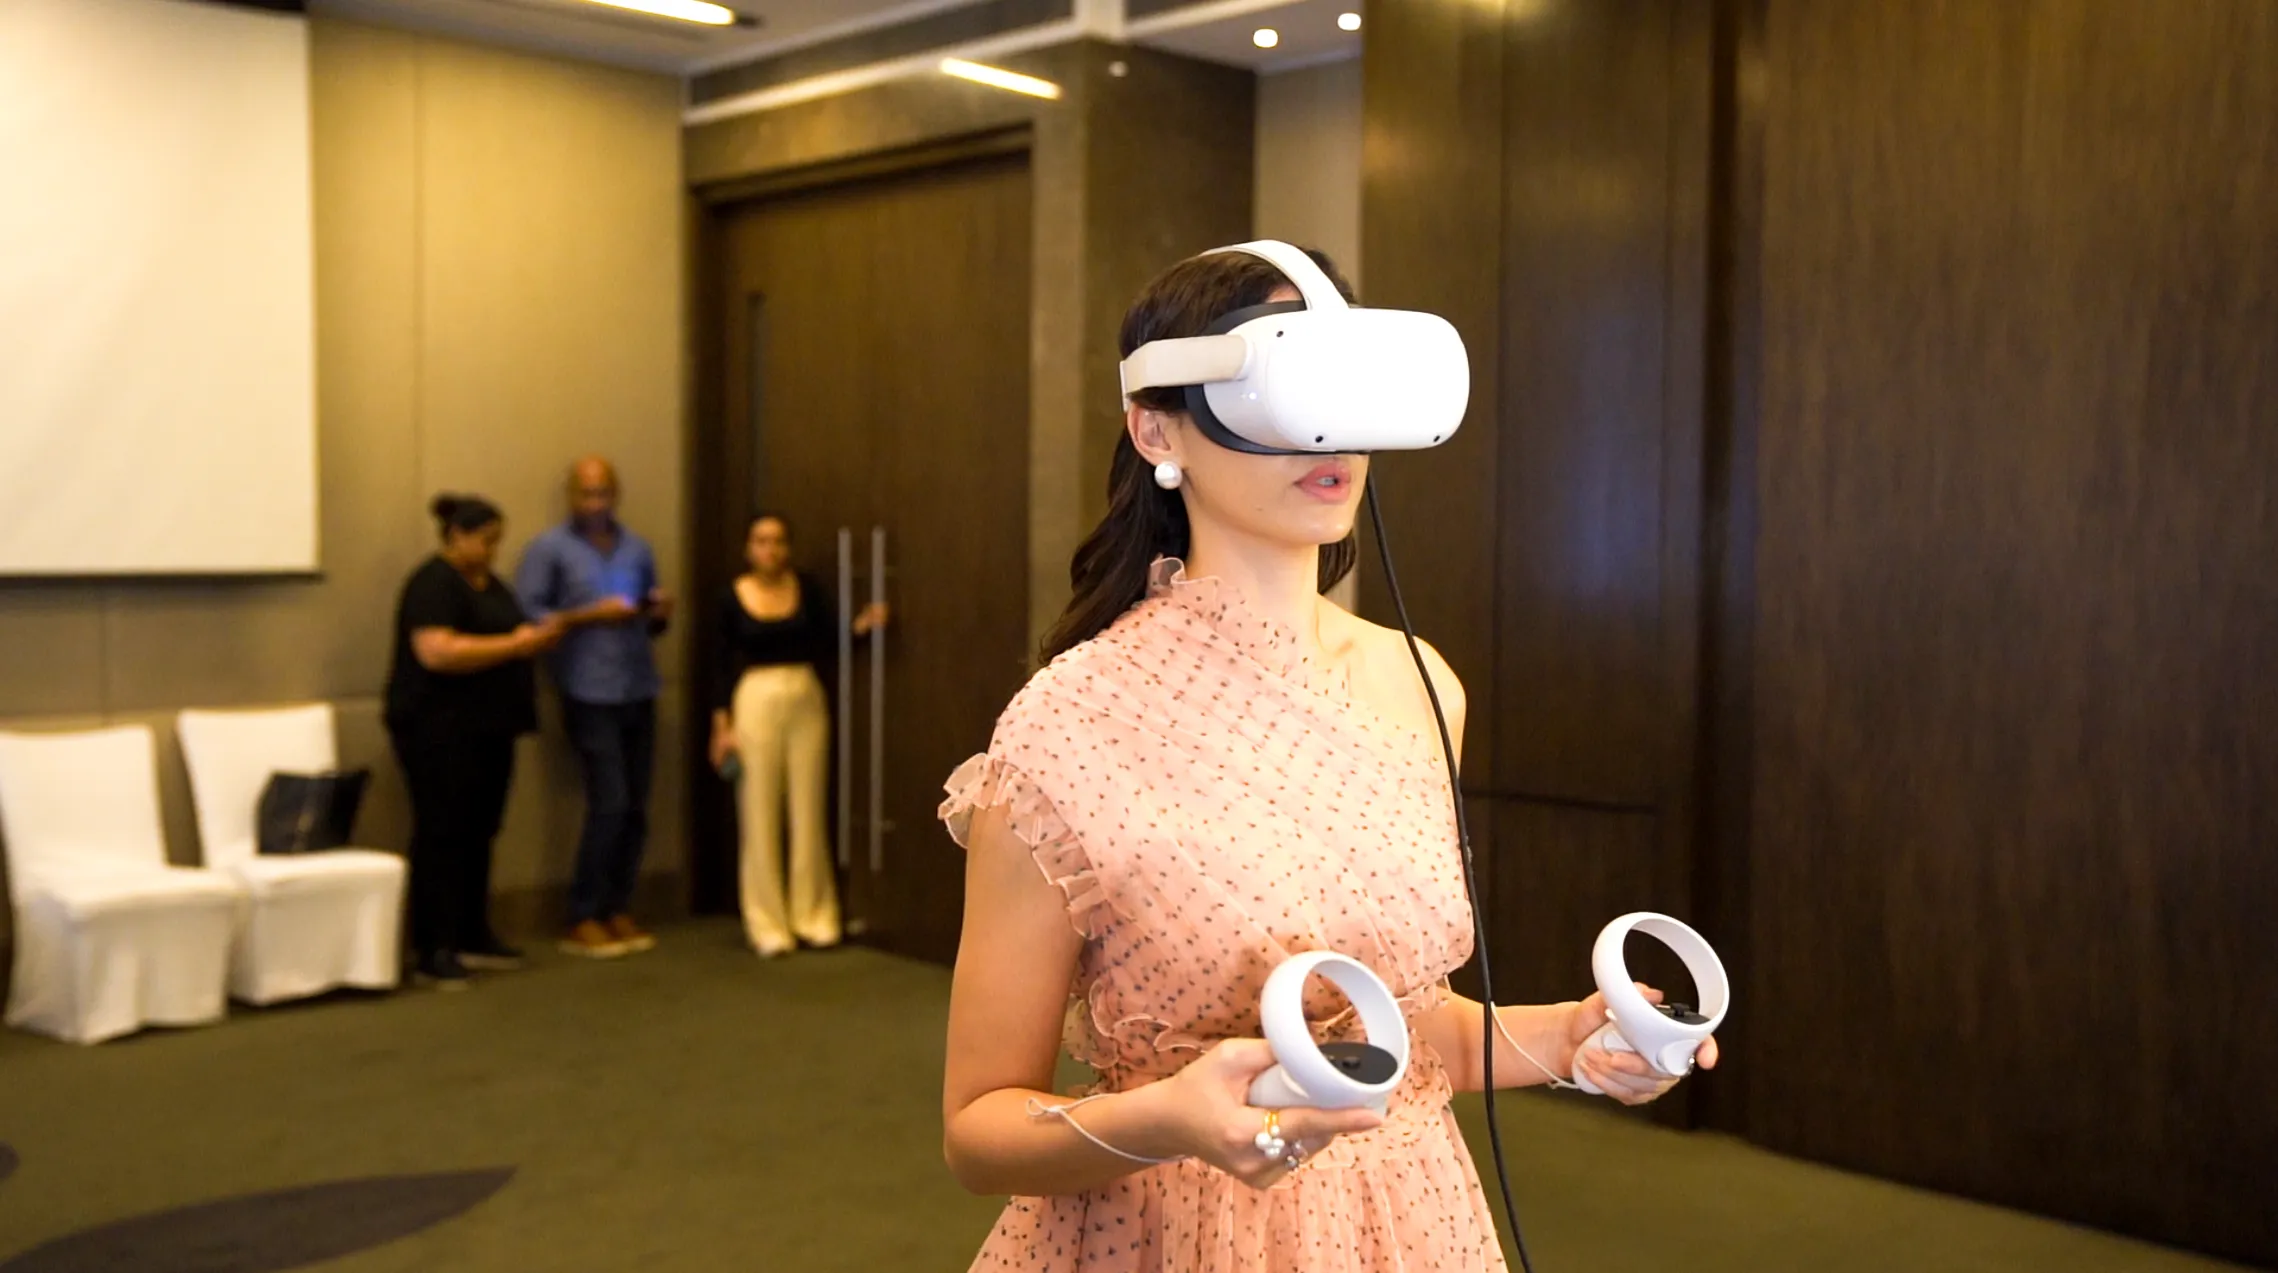
Enterprise launches demand data-backed decisions. Ink In Caps analytics platforms now support hybrid events. They fuse VR walkthroughs with live metrics. Retail heads use them for pop-up optimizations. Decision-makers gain dashboards tailored to KPIs like LTV projections.
This approach extends to Experience Centers. Interactive walls feed into unified analytics. Projection mapping activations track multi-surface engagement. Brands report sustained 25-40% uplift in metrics year-over-year.
For your next launch, Ink In Caps builds analytics into immersive setups from day one. Contact our team to audit your event data needs and deploy a pilot dashboard—elevating dwell time and lead precision without the guesswork.
About the Author

SEO Executive
MORE FROM OUR CREATIVE MIND
 Get Everyone's Attention With These Amazing Experiences
 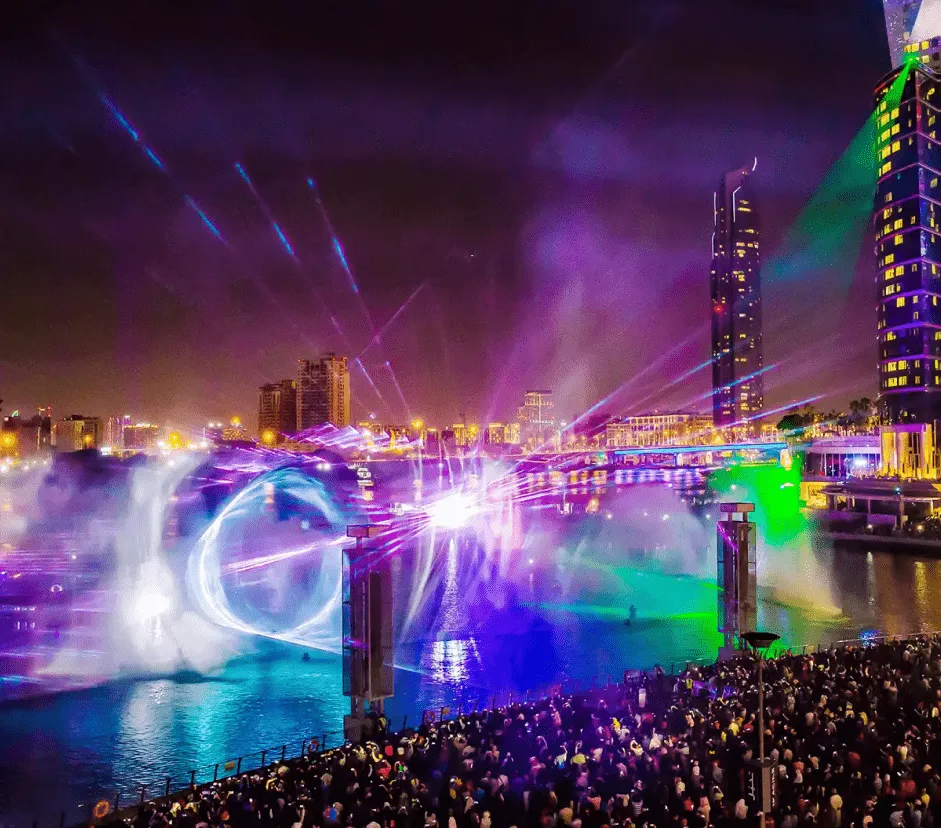 Is 3D Projection Mapping The Future Or The Present?
 About the Author
SEO Executive
MORE FROM OUR CREATIVE MIND
Get Everyone's Attention With These Amazing Experiences Is 3D Projection Mapping The Future Or The Present?  Protean —
 Amazon Shipping Interactive 3‑Layer Game (Sambhav 2025)
 Contact Us Now: