.CNhas5IL_ZqBJiz.webp)


Maruti Suzuki’s 3D Microsite Drives Engagement at Bharat Mobility Expo

When scale and expectation collide on the same floor, a launch stops being an event and becomes an operations problem. At the Bharat Mobility Global Expo 2025, Maruti Suzuki faced exactly that: a high-stakes product reveal inside a noisy, crowded hall, where a single booth no longer allowed the brand to tell a complete story. The response—an intelligent, gamified microsite that threaded digital touchpoints through thirteen distinct zones—turned an unwieldy environment into a measurable, repeatable audience journey. The results were striking: strong dwell-time improvements, clear engagement lift, and a volume of first-party data that moved conversations from ‘felt impressions’ to real, actionable insight.
What the challenge actually was

Maruti Suzuki used the expo to introduce the E-Vitara, their electric SUV offering. The company’s presence at the show was intentionally expansive: multiple experience zones, product showcases, and live demonstrations. But traditional formats—big stages, VR rigs at a single spot, or robotic installations—were struggling to translate into usable analytics. The old model produced buzz, but it didn’t explain how people moved through the story, which features resonated, or how long visitors actually spent with each narrative element. That lack of granular measurement made it difficult to refine messaging or quantify ROI from the exhibition.
At scale events like this, ambient noise and crowding turn every interaction into a risk: people either cluster and block traffic, or they skip the experience entirely. Maruti Suzuki’s brief required better flow management, higher content retention, and reliable measurement—without putting technical friction between the brand and its audience.
The decision: decentralize the pavilion and design for flow
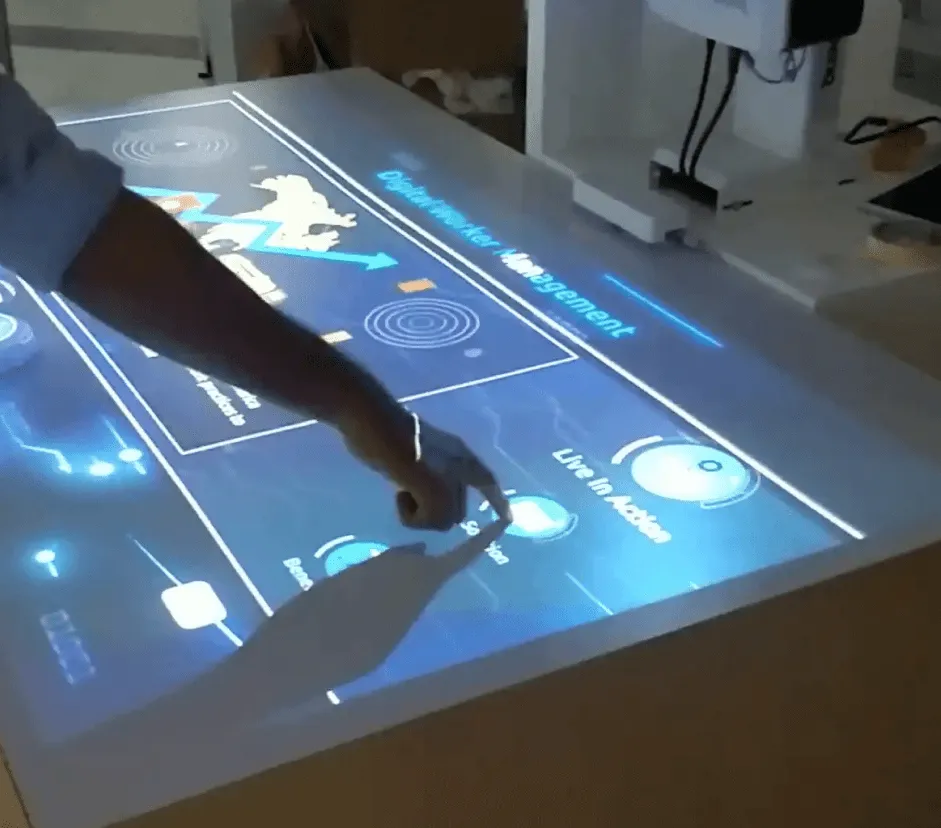
Rather than concentrating attention in one place, the pavilion was reimagined as a network of thirteen zones. Each zone told a discrete chapter of the E-Vitara story: first impressions, charging and eco-systems, maintenance solutions, and more. That fragmentation demanded a way to navigate physically and narratively—so Ink in Caps developed a 3D gamified microsite that acted as a distributed curator.
Visitors followed their curiosity rather than a schedule. A 3D map on the microsite guided them, QR codes at each zone unlocked content and audio, and progress markers rewarded exploration. The system was deliberately friction-light: users scanned, consumed short-form media, and moved on. The objective was not to trap attention, but to structure it—create micro-moments of focused interaction that could be stitched back into a coherent behavioral picture.
UX and engagement mechanics that worked

A few pragmatic design choices made the difference:
Rewarded progression: Users who scanned QR codes across zones unlocked digital goodies. Completing more zones elevated rewards—culminating in high-value incentives such as signed merchandise. This converted casual curiosity into a structured completion loop.
Muted, personal AV: Instead of blasting the hall with sound, the pavilion featured zone-specific screens with muted video and QR-driven audio playback. That allowed visitors to experience a layered audiovisual narrative on their own device, improving retention and avoiding crowding.
Visual progress and map-based navigation: The microsite’s 3D gamified map showed “unlocked” features and visual progress bars. The map served both orientation and motivation: it made exploration feel like achievement rather than aimless browsing.
These mechanics reframed the expo from a series of static displays into a guided, opt-in narrative journey.
The backbone: pragmatic engineering, not theatrical complexity

Under the hood, two priorities ruled: reliable concurrency and device-agnostic delivery. Ink in Caps based the experience on Unity for consistent rendering and a socket-driven back end hosted on AWS to handle real-time synchronization. The engineering choices were guided by the expo’s constraints: support for a broad range of network conditions (from 2G to 5G), security for user data, and the ability to scale to tens of thousands of simultaneous sessions. That meant the microsite could synchronize audiovisual cues across devices without depending on local Wi-Fi, and it held up under peak traffic—50,000+ concurrent users could be supported without compromising playback or analytics.
Crucially, the system prioritized operational clarity. Daily reports captured scan activity by zone, dwell times, and the content features that generated the most interest. Those outputs turned anecdote into evidence, letting marketers refine creative decisions in near real time and plan follow-up campaigns grounded in empirical audience behavior.
What the metrics say

Good experiential design convinces with metrics. The pavilion’s performance was not just feel-good: it moved the needle.
1.4 million QR scans provided a robust signal of active interest across the pavilion.
52% active engagement: over 286,000 unique visitors scanned more than one QR code—more than double typical industry engagement benchmarks for events.
Significant brand lift: social sentiment around Maruti Suzuki improved markedly—recorded as a roughly 40% increase in positive social mentions compared to prior expos.
Beyond headline KPIs, the most useful insight came from zone-level behavior. Zone 1 (first look at the E-Vitara) and Zone 3 (charging, eco-solutions, and service innovations) consistently generated the highest interaction and longest dwell times—data that directly informs product messaging, retail merchandising, and after-event engagement strategies.
Why this matters for decision-makers
For marketing leaders and enterprise stakeholders, three lessons stand out.
Design for measurable moments, not impressions. Traditional activations trade measurability for spectacle. This project demonstrates that you can preserve the spectacle while instrumenting each micro-interaction for analytics. When every interaction is trackable, budgeting and performance conversations become evidence-led.
Decentralization reduces friction. Splitting a narrative into short, self-contained experiences reduces bottlenecks and gives visitors freedom—while still allowing brands to guide the overall arc. This approach works particularly well for complex products where different features appeal to different user segments.
Operational resilience beats technical vanity. The choice of robust, well-supported technologies and the ability to operate across variable networks made the difference. Fancy effects are worthless if the platform fails under load; reliability must be a design constraint, not an afterthought.
These are practical takeaways for any organization planning a large-scale expo, retail activation, or product roadshow.
Behind the scenes: trade-offs and decisions
Two design decisions that look simple on the surface required trade-offs:
Muting audio and routing it to user devices sacrificed the immediacy of a shared theater experience, but it removed a major source of crowding and improved personalized retention. For a brand that needs measurable resonance across many visitors, that trade-off favored clarity over spectacle.
Reward mechanics tied to completion required careful calibration to avoid turning the activation into a chase for merch rather than a learning experience. The team balanced this by making rewards meaningful but secondary to the content—so completion reinforced comprehension, not just collection.
These choices reflect a philosophy where behavior change and insight are the primary objectives; tangible incentives facilitate engagement but do not replace thoughtful storytelling.
What it means going forward
Expos and large-scale activations will continue to reward strategies that marry creativity to instrumentation. For product launches—especially in categories where technical features matter—disaggregating a story into measurable micro-moments creates more pathways to conversion: stronger leads, clearer follow-up signals, and smarter content retargeting.
For Maruti Suzuki, the microsite did more than entertain. It created a dependable feed of first-party engagement data that can inform everything from showroom scripts to digital campaigns. For brands seeking to modernize event playbooks, the lesson is operational: design for flow, instrument for decisions, and pick platforms that tolerate real-world variability.
A short practical checklist for teams planning a similar activation
Break the story into discrete zones; make each zone deliverable in 30–90 seconds.
Use a single lightweight entry experience (microsite or PWA) rather than multiple apps.
Drive on-device audio/video via QR or deep links to avoid ambient noise and crowding.
Implement basic rewards that reinforce completion, not completion for its own sake.
Instrument each zone with simple analytics: scans, dwell time, completion rate, and what content was replayed.
Build for concurrency: simulate peak users and ensure the stack scales under stress.
Closing: commercial clarity without hype
The Maruti Suzuki pavilion at Bharat Mobility Expo 2025 is a case study in measured experiential design. It shows that when creative teams pair narrative clarity with tactical engineering and an insistence on first-party data, an expo can become a controlled channel for learning—not just a momentary PR spike. For marketing leaders and decision-makers, that’s the point: an activation should be a repeatable, optimizable part of the marketing mix, not a one-off spectacle.
Ink in Caps approaches these problems with that exact posture—creative rigor paired with operational discipline, and a bias toward measurable outcomes rather than theatrical complexity. If your team is preparing a launch or an experience where crowd management, content retention, and data quality matter as much as the creative brief, a focused microsite-driven approach—paired with a simple reward loop and zone-level analytics—will turn an expensive presence into a proven investment. For those planning the next memorable activation, this is the architecture to start from: design the moments, make them measurable, and treat the activation like a data project as much as a creative one.
About the Author

SEO Executive
MORE FROM OUR CREATIVE MIND
 Get Everyone's Attention With These Amazing Experiences
  Is 3D Projection Mapping The Future Or The Present?
 About the Author
SEO Executive
MORE FROM OUR CREATIVE MIND
Get Everyone's Attention With These Amazing Experiences Is 3D Projection Mapping The Future Or The Present? 


Contact Us Now: